
Web Development Services & the State of E-Commerce
Web Development Services & the State of E-Commerce by Market Action Research
(Last Modified: March 25, 2021, 9:09 p.m.)
These days one of the biggest mistakes a company can make is underestimating the true value of web development services. Recent market research data by Adobe’s Digital Economy Index shows significant and notable year over year growth from 2014 to 2019.
Web Development Services
Even at a global level to the local economy deeply affected by the COVID-19 pandemic, e-commerce sales continue to surpass previous online sales records. In fact, while many businesses were forced to shutter their doors in March of 2020, the April 2020 e-commerce sales boomed by nearly 50% compared the previous months.
These stats come from data which tracks over one trillion online transactions across more than one hundred million online products. The research also considers eighty of the top one hundred online retailers accounting for a considerable amount of data and examines a vast population of information. In other words, this helps increase the accuracy of the data. For purposes of examination, we obtained a copy of the raw data to analyze ourselves. Using technologies such as Python, numpy, pandas, and other statistical models we examined the data. Now, let’s take a closer look at what the data could be telling us.
The State of E-Commerce 2020
At the moment of writing this we are are only half way through the year 2020. There is still much in this year to go and possibly a lot can change. As it stands, across all industries, e-commerce continues to be on a growth spurt and has continued on a positive trajectory. This is likely in part due to more companies utilizing web development services to bring their business online and their products and services to customers across the world. The chart below shows the total change in growth (cumulative change in percentage) since the year 2014, which is over a five year span. One of the more notable statistics here is the total growth in e-commerce sales from the early months of 2020 until about June 2020.
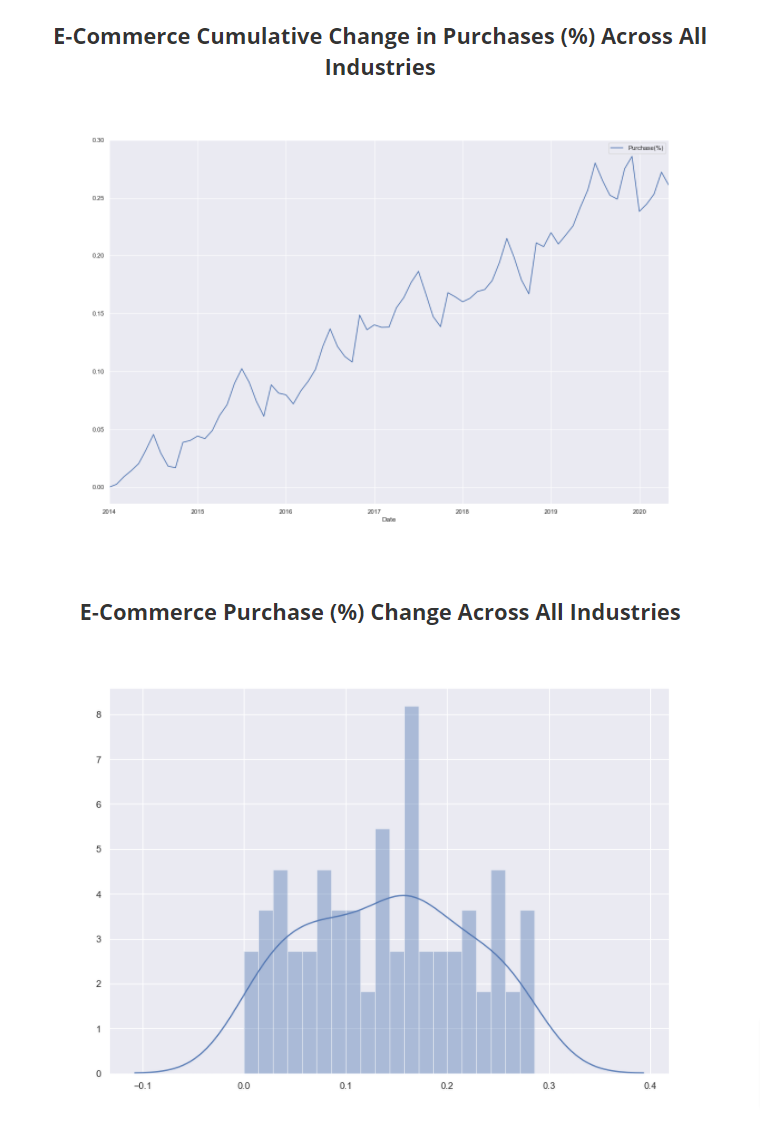
Looking at a chart with the kernel density estimate and histogram, the data indicates that the overall monthly year over year growth rate has continued to remain positive since 2014. Alternatively, the bar chart shows the total change in growth percentage points since 2014, with 2019 being a big year in growth for e-commerce sales.
Aggregating over 5 years of e-commerce data, compliments of Adobe, our research analysis suggests a slight cyclical pattern in online purchases across the entire industry. This however is not much of a surprise, especially when you look at the months that typically experience the highest change in sales growth. For example, in over the past five years, July’s sales growth has grown the most, while the holiday season in November and December have become increasingly more familiar for online shoppers. In turn, those months have seen the most amount of growth overall. What may be a surprise to some businesses however is the overall track record of growth in e-commerce. This is practically an opportunity that businesses cannot afford to miss out on.
Industry E-Commerce Comparisons 2020
Of course we would be remiss if we did not take a look out factors that impact specific industries, since selling a lawn mower is not the same as selling a pack of pens. This is where examining cumulative inflation by industry category comes into play. This chart is not looking at the overall growth of the online economy (as in the charts above), but instead this chart is looking at inflation or deflation in the price of goods and services per industry over time. For example, you will notice that on average most industries selling goods and services online are seeing a decline in inflation in for the five plus years.
There is a few ways to interpret what this could mean. For one, it could suggest that the U.S. dollar purchasing power is increasing. In other words, the lessons we learned in Economics 101 about the time value of money are playing their predictable effect on the market. Whereas if you could purchase a good or service a year in advance it would have cost more today than it would in a year from now. It’s not by much, but the overall trend is worth observing at scale, especially for businesses owners and operators. Since an orange that costs $1.01 today and $1.00 in a year from now may not seem like much, that collective concept when thinking of purchasing 1 Million oranges starts to add up. In fact, the data suggests this has been mostly true for a majority of industries selling goods and services online since 2014, with the exception of flowers, related gifts, and groceries. Using a kernel density estimation and histogram plot overlaying each other shows that across all industries the general trend is showing a decrease in inflation for online goods.
As pointed out earlier, there are likely multiple factors that are contributing towards these trends. For instance, as a result of businesses investing more heavily web development services, companies have become more attuned and familiar with selling products online. Also, as businesses figure out ways to implement these technologies their cost of providing goods and services are likely to decrease, which can lead to a reduction of marginal costs and increases in marginal return. Some industries have become increasingly more high tech, which also means they are likely benefiting from the increased capacity and capability that those technologies bring to their enterprises, as well as, the various benefits that come with them and the long-term cost savings.
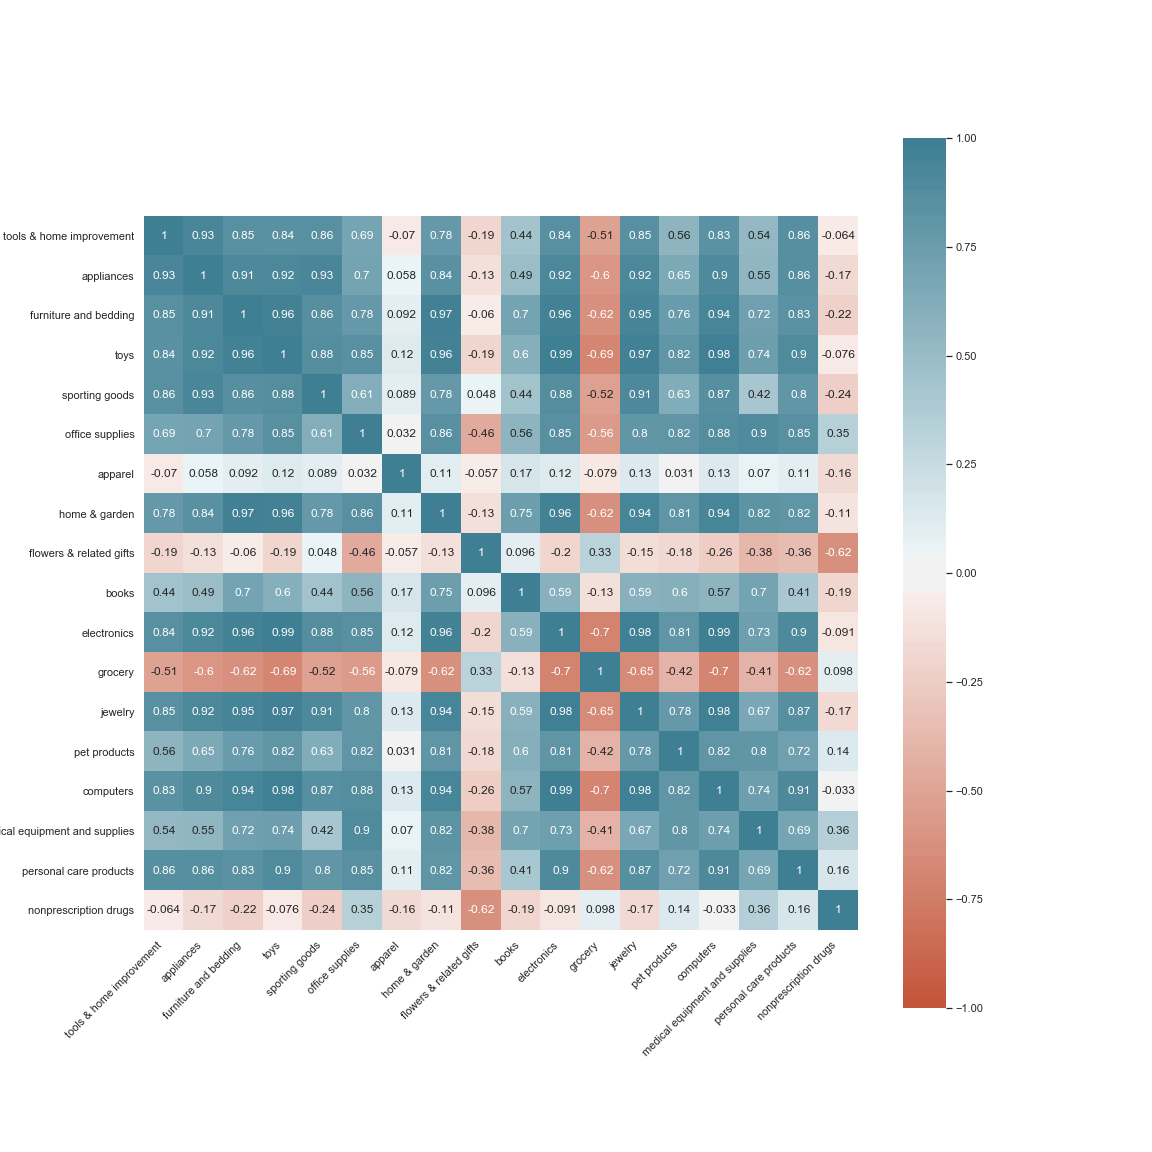
The following chart is a correlation heatmap that shows the representation of the data as compared to other industries. The annotations indicate a positive or negative relationship to each categories counter part in the x and y axis of the chart. It is important to note that it would be improper to include that correlation equals causation, because there are often many things that can contribute to a rise or fall of inflation. However, it is nonetheless an interesting piece of data that can be used as an interesting starting point for further analysis and observation.
Web Development Services to the Rescue
Your online web presence has now become the virtual extension of your company, how your brand is perceived, how it connects with new and existing customers, and is now a vital part of your overall brand experience. Every company is a technology company, whether they know it or not. This is why companies that understand the value of web development services consider building their web site, web portals, web apps, and other online applications. They also realize these virtual portals have become a key part of the overall experience they offer to their clients, customers, and employees. The digital consumer is becoming more technologically savvy every single day. Younger generations don’t even know a world without it. It has become largely unacceptable to use cookie cutter templates, that your customers have already seen on plenty other websites, as well as, some competitors. This is why we strive to help our clients deliver the best web development experience possible.
Originally Published: March 23, 2021, 2:26 a.m.

